
Database Basics
Database Nomenclature
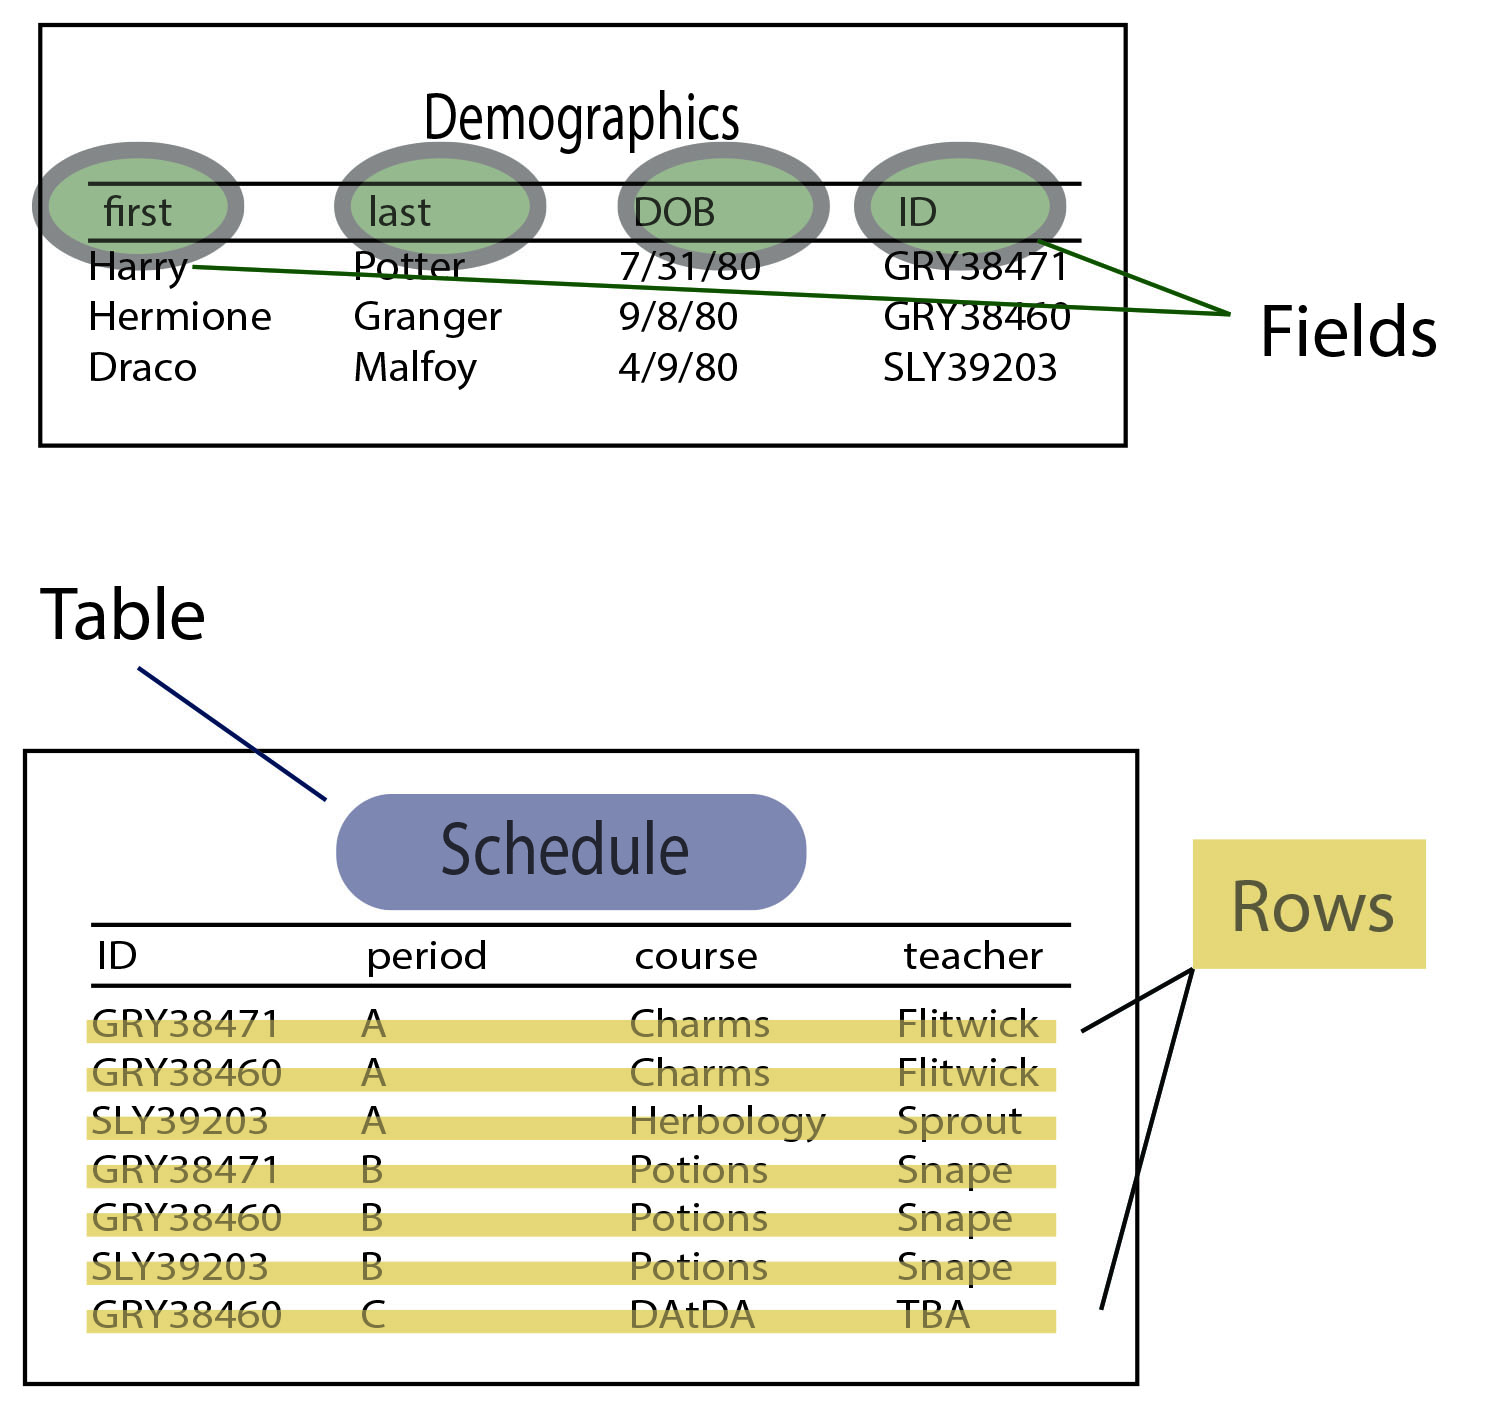
A database contains information organized in tables. Tables, in turn, consist of one or more columns, or fields. Each entry in the table is a row, or record.
A school’s database of students might have two tables, a “Demographics” table and a “Schedule” table. The “Demographics” table might have fields for student name, date of birth, student ID, and so on. The “Schedule” table might have fields for student ID, period, course, and teacher.
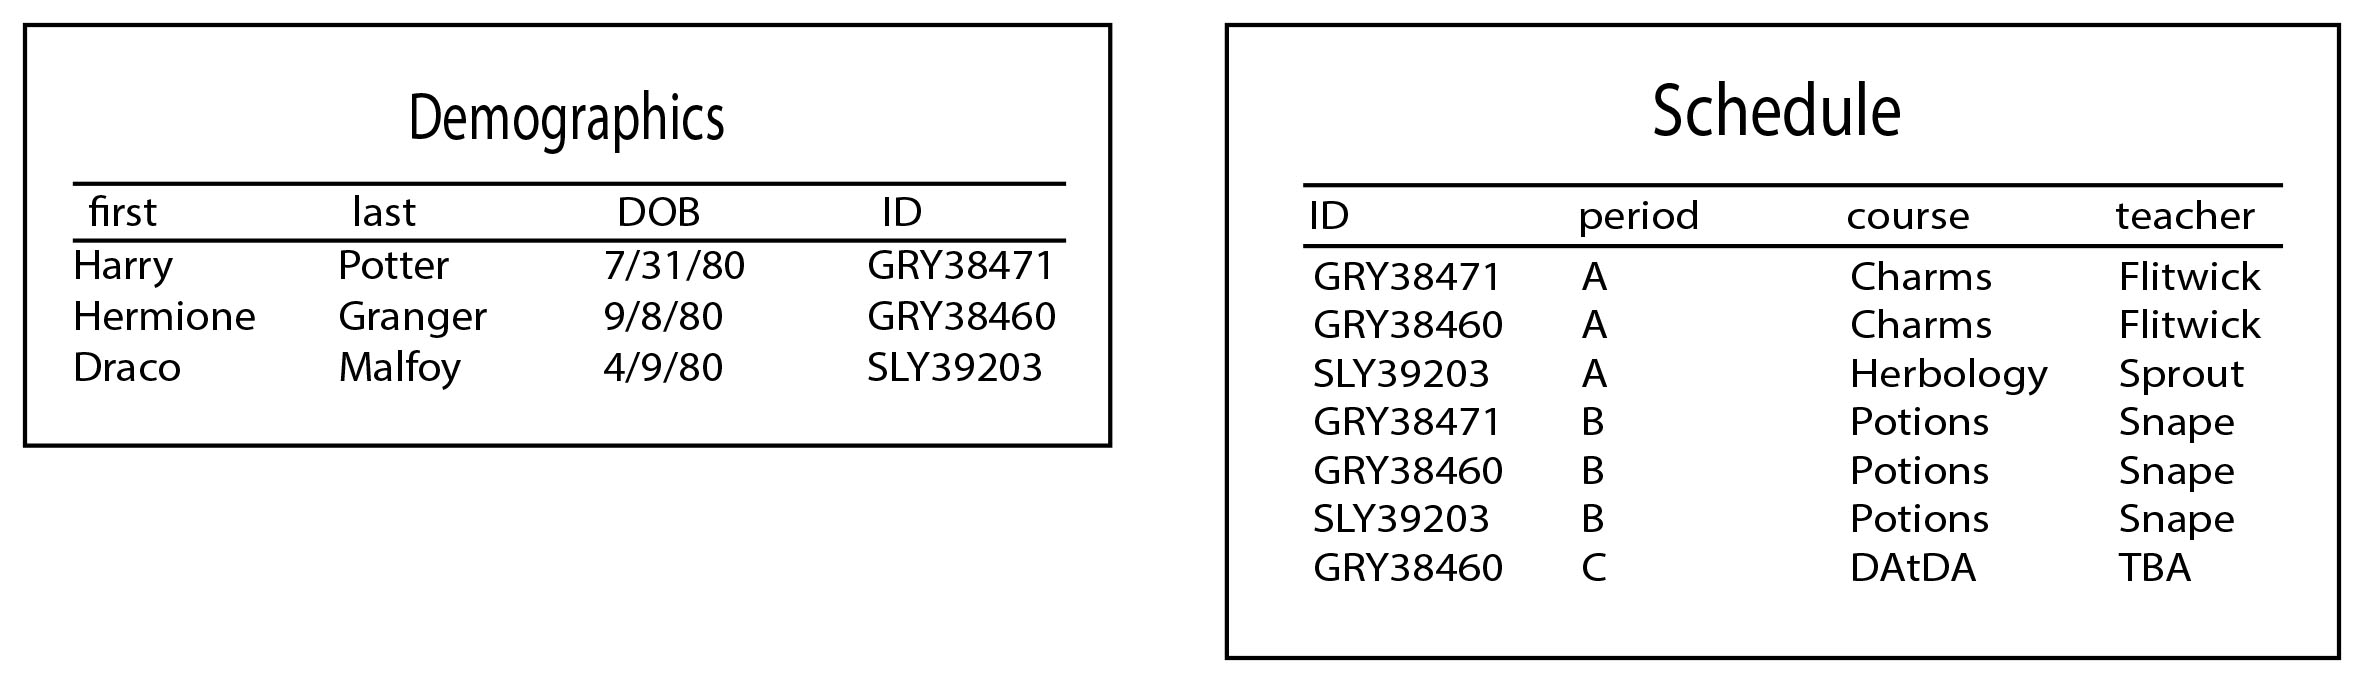
The “Demographics” table would have one row, or entry, per student in the school. The “Schedule” table would have one row for every course a student was taking (e.g. a student taking four courses would have four rows in the table.)
In general, we’ll use the TABLE.FIELD nomenclature to show where database pieces are found. So, when referring to where a patient’s first and last name are found in the database, we’ll say DEMOGRAPHICS.FIRST and DEMOGRAPHICS.LAST.
Every table should have an index field, which allows it to be linked to other tables. In this example, we know that Hermione’s student ID is GRY38460, and it’s present in both DEMOGRAPHICS.ID and SCHEDULE.ID, even though Hermione’s name isn’t in the Schedule table, we can tell that Hermione’s period B class is potions. That’s why it’s important for every student to have a unique ID – so that each record in the Schedule table can be matched back to a student.
In this case, the index fields are DEMOGRAPHICS.ID and SCHEDULE.ID. The two tables are “joined on” the student ID fields. This often looks something like JOIN ON (DEMOGRAPHICS.ID = SCHEDULE.ID). See Module 3 Part 1 for more on joins, here:
Knowing What’s Where in the Database
In order to make reports from OP data, you have to know where each data piece is stored in the database- what table and field. The index of “what’s where” is called a data dictionary (see Data Dictionary, Module 2 Lesson 2.)
In order to make the most out of a report, you have to know how similar sets of data are different, and which of the similar sets you want for your report. For example:
How many patients did I see in the month of January? This could be defined as:
- How many patients were on my schedule with completed appointments?
- How many billed encounters was I the rendering provider?
- How many encounter notes have my name on them as rendering provider?
How many flu vaccines did I give to patients in the month of November? This could mean:
- How many flu shots did I bill for?
- How did my flu vaccine inventory decrease?
- How many patients are on the schedule with “flu shot” in the text?
How many active asthmatic patients do I have in my practice? This could mean:
- How many active patients have a diagnosis of “asthma” in their problem list?
- How many active patients had an ICD-9 of 493.xx in their claims sometime in the past 2 years?
- How many active patients have an asthma action plan in their charts?
In each of the above examples, it would be great if all three methods gave you the exact same numbers for each question. But records kept by human beings are imperfect – in the first example, unless you are scrupulous about reconciling your schedule against your charted notes, and your billing against your schedule, you will occasionally have discrepancies. In the second example, any practice who regularly reconciles their physical inventory of vaccines will find vaccine administration errors. And in the third example, it would be great to think that all of a busy practice’s asthmatics are properly recorded in the problem list and have a current asthma action plan, but practically speaking, that just doesn’t happen 100%. of the time. In fact – are you even sure that 100% of asthmatics in your practice have “Asthma” as an active problem in their problem list? (And how are you sure that you’re sure?)
Depending on which of the data sources you use to answer each of these questions, the reports may vary — sometimes significantly.
I Have Bad News: Your Data Isn’t Perfect
Don’t be surprised with the result of an OP report’s “discrepancies” when the discrepancy is not caused by the report itself, but by inconsistent data entered by human beings into the database.
On the other hand, parallax may be useful — that is, reports with discrepancies may give you good opportunities to improve your process. Let’s say for the month of January, you had 358 completed appointments on the schedule but only 352 billed encounters. This means either:
- You missed an opportunity to bill for 6 patients, or
- You had 6 patients who cancelled their appointment and/or didn’t come, but the appointment was accidentally marked “completed” rather than a more appropriate disposition (“no show,” “cancelled,” etc.
In either situation, you can use the opportunity to A) improve your billing or B) improve your scheduling.
Sometimes, even if your data is perfect, three different methods won’t give you the same numbers because the methods are designed to give three different answers. For example: how much revenue did I bring in for the month of February?
By this, do you mean…
- How much cash entered the practice in February that was attached to current or prior work?
- For patients I saw in February, how much cash came in – at any time in February or since then?
- For patients I saw in February, how much cash came in for that work before the end of February?
Each of these might be a useful number to know, depending on your purpose, but they are different numbers. If you try to reconcile two financial reports based on two different methodologies, you will be frustrated by an impossible task.
For financial and accounting reports, there are a few additional peculiarities:
- For the “month of February,” this means 2/1 through 2/28 – but this can be defined as payment dates, payment-posted dates, or daysheet dates.
- Payments may appear on one day, but if they are corrected, voided, or recouped later, you may need to determine whether the original payment or the corrected payment should appear in the originally-posted date, and whether anything should appear on the corrected date.