
The OP Reports Interface
OP Reports has its component reports arranged in a tree hierarchy. The open folder icons (red rectangles) show the currently activated file path. You can switch between list view and detail view (green oval):
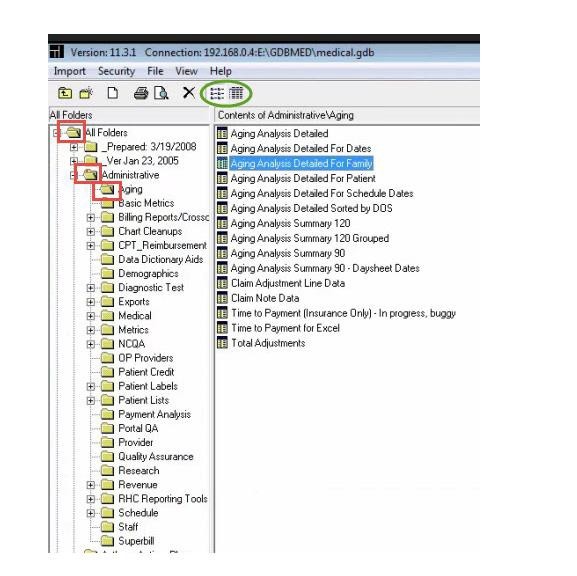
Double-clicking on any report opens it in Run mode.
Right-clicking on any report and clicking Design opens an existing report in Design mode. After right-clicking, you can also choose Open (the same as opening it in Run mode) or New Report.
Creating OP Reports: The OP Report Builder Interface
Now that you know where to find stuff in the OP database (using the Data Dictionary) and how to ask the OP database for what you want (using SQL), it’s time to put them together and make a report.
When you first open a report in Design mode, it looks like this.
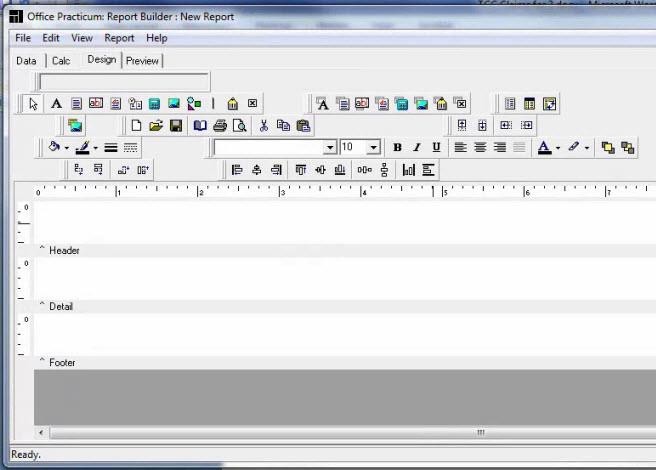
Let’s take a closer look at the different elements:
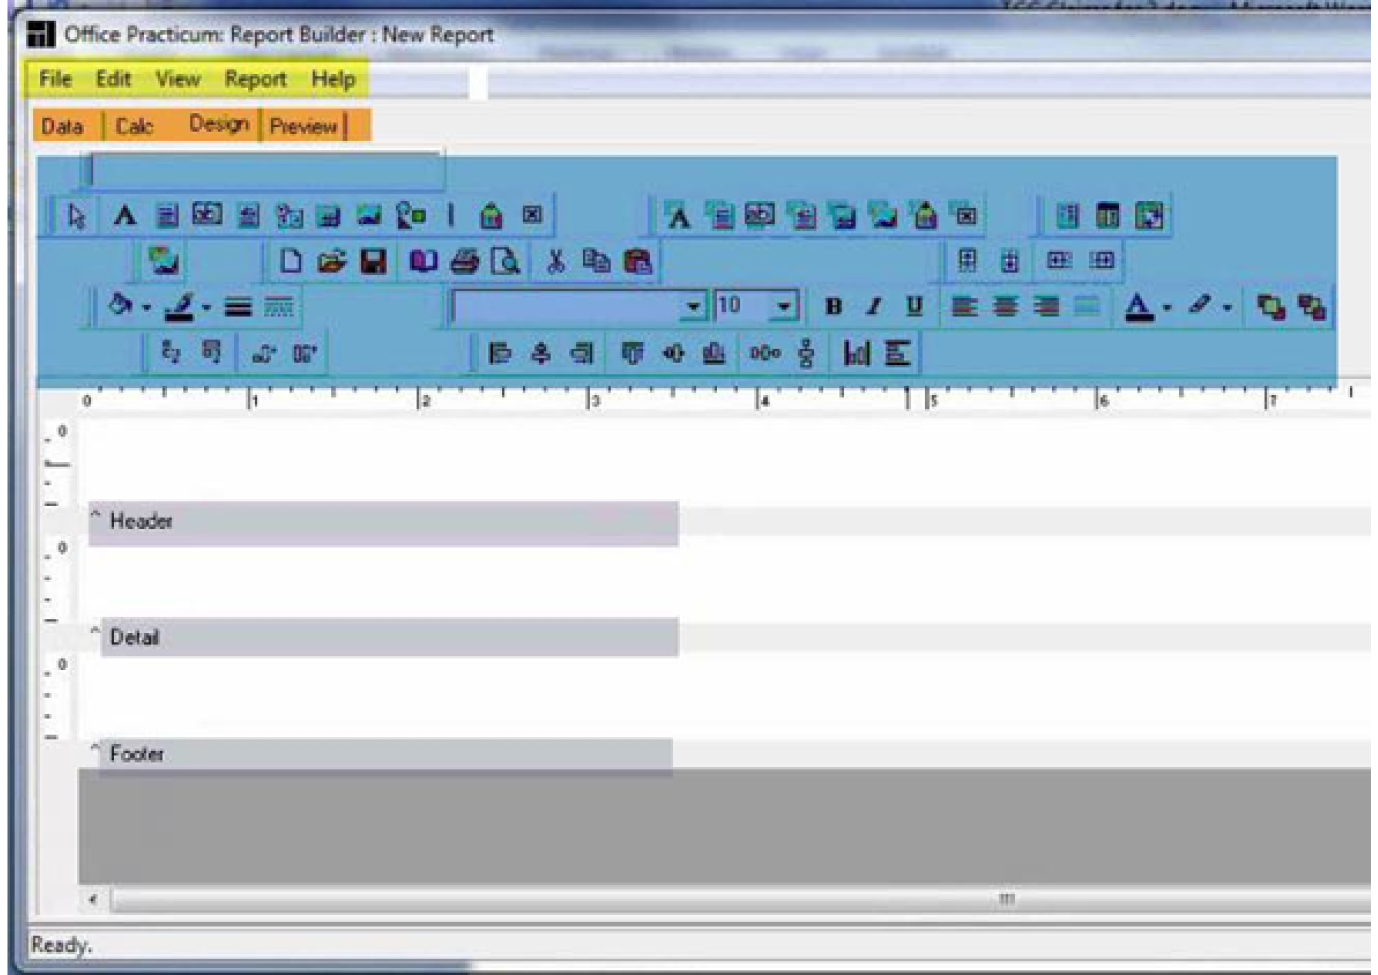
The menu bar (highlighted in yellow) has four elements – File, Edit, View, and Report (Help is not currently functional.) All of these elements are present when the Design tab is open. Only the File element is visible when the Data tab is open. If you can’t find what you want in the menu bar, try switching your Report Builder tab.
The Report Builder has four Construction Tabs (highlighted in orange) – Data, Calc, Design, and Preview.
- The Data tab allows you to select the tables and fields you want, as well as set the criteria for your data query. This is also where you can join two or more tables, perform simple calculations, decide what order you want the data sorted in, and other SQL commands.
- The Calc tab allows you to perform more complex calculations and sophisticated programming. There’s definitely a lot of cool stuff here, but it’s outside the scope of this tutorial.
- The Design tab is where you lay out how you want your report to look – how the data is laid out on the page, in terms of fonts, color, header/footer, graphics, pagination, date/time of printing. Module 4, Lesson 4, lists the tools you use to create these elements.
- The Preview tab is, just like it sounds, where you can preview your report in progress, based on what you’ve already entered in the other three tabs.