
Walkthrough Example #1: Find BMIs and the Correct Z-Code to Maximize P4P Revenue
Customizing your own OP Reports can help you produce P4P reports for bonus revenue.
NB: this is an old example from way back, when we still used ICD-9 codes. But you should still get the idea.
Background and the Need
We recently received this communication from one of our Medicaid MCOs:
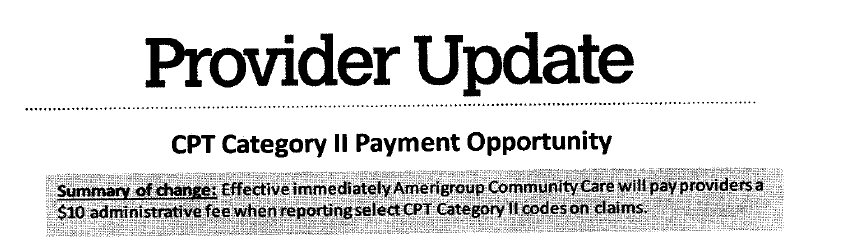
So $10 just for adding a line item to my claims got my attention. What do I have to do? Keep reading:
I can find the previous claims I submitted for these patients that meet the criteria and send in another line item for $10. If I can find 50 such patients, that would create another $500 in revenue, less perhaps an hour of my biller’s time to create and send these claims.
(Let’s assume this exercise is actually going to yield enough patients to make it worth my while. I’ll say at the outset that patients 18+ are a small part of our practice, and patients 18+ who have Amerigroup insurance are an even smaller part of our practice. But for the sake of argument, let’s pretend that this exercise might potentially yield us several hundred dollars.)
Based on this, I want an OP report that will find the BMI for:
- All patients with Amerigroup insurance (either primary or secondary)…
- Who I saw on or after 11/1/2013 for CPT 9920x, 9921x, 9938x, 9939x, etc…
- Who were 18 years or older on the date of service.
Part One: Creating the Report and Roughing It In
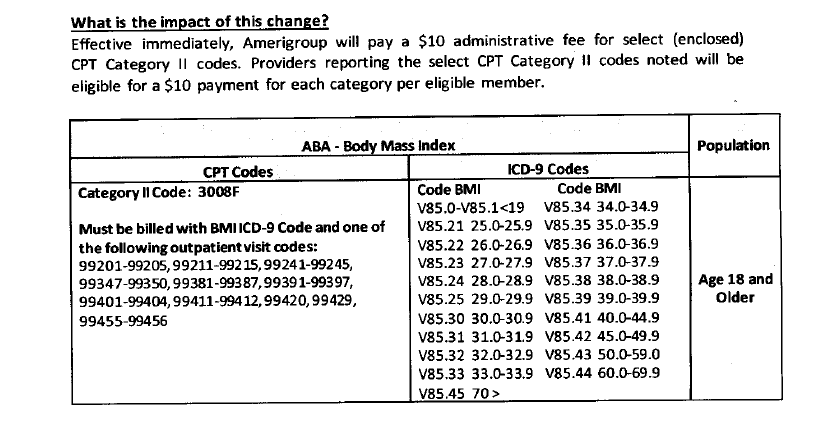
In OP Reports, right click and select New Report.
From the Data tab, select File… New… and choose Query Designer:
Now I have to decide what data bits I want. In order to submit these claims, my biller will want the patient’s chart number, the date of service I saw the patient, the CPT that I saw the patient for, the patient’s BMI to classify it, and the proper BMI ICD-9 code based on the patient’s BMI.
Where do I find these data bits within OP? From the Data Dictionary, I find —
- Patient’s chart number: REGISTER.PATNO
- DOS of visit: ARCHIVE_TRANSACTIONS.DATE1
- CPT of visit: ARCHIVE_TRANSACTIONS.CPTCODE
- Most recent BMI: PHYSICAL_CHART.BMI.
- BMI ICD code: I will compute this based on the BMI and the information supplied by the insurance company.
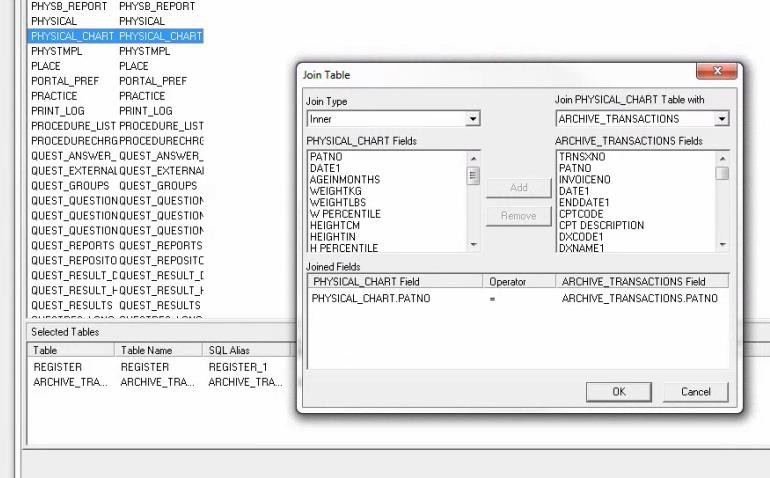
So at a minimum, I will need data from the tables REGISTER, ARCHIVE_TRANSACTIONS, and PHYSICAL_CHART.
In Query Designer, in the Table tab, I start by selecting REGISTER, then selecting ARCHIVE_TRANSACTIONS and linking the two tables together. I can link them using the PATNO field because REGISTER.PATNO is always the same as ARCHIVE_TRANSACTIONS.PATNO:
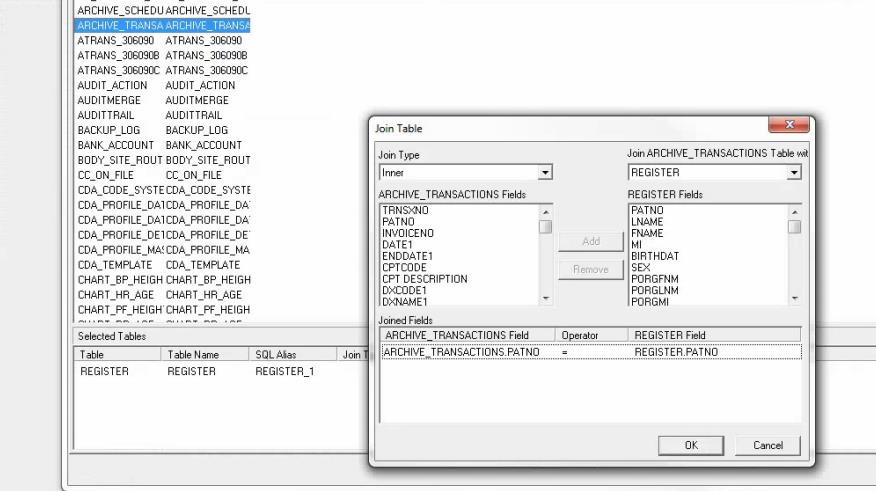
Then I add the PHYSICAL_CHART table, again linking it using the PATNO field.
Here I’ve linked PHYSICAL_CHART.PATNO to ARCHIVE_TRANSACTIONS.PATNO – but you could get the exact same results by linking PHYSICAL_CHART.PATNO to REGISTER.PATNO. (If you wanted to be really tidy, you could even link PHYSICAL_CHART.PATNO to both ARCHIVE_TRANSACTIONS.PATNO and REGISTER.PATNO, but that’s not necessary here.)
So now I need to select the fields I want from these three tables. Clicking on the Fields tab in Query Designer, I double click on all the fields I want:
- REGISTER.PATNO
- REGISTER.BIRTHDAT (which I will use to compute age on the date of service)
- ARCHIVE_TRANSACTIONS.DATE1
- ARCHIVE_TRANSACTIONS.CPTCODE
- PHYSICAL_CHART.BMI
- PHYSICAL_CHART.DATE1 – that is, the date the BMI was computed, which may or may not be the day I saw the patient most recently.
(Let us assume for the sake of argument that Amerigroup is OK with me sending BMIs computed within a year prior to the visit. That is, if I saw a patient for a well visit in May and computed a BMI at that visit, then saw them again in December but did not do a BMI, I can still submit the BMI from the May visit with the December date of service.) Seeing how recent PHYSICAL_CHART.DATE1 is will help me decide if it’s worth submitting. If the most recent BMI date is, say, 2007, that’s probably not what the P4P is looking for.
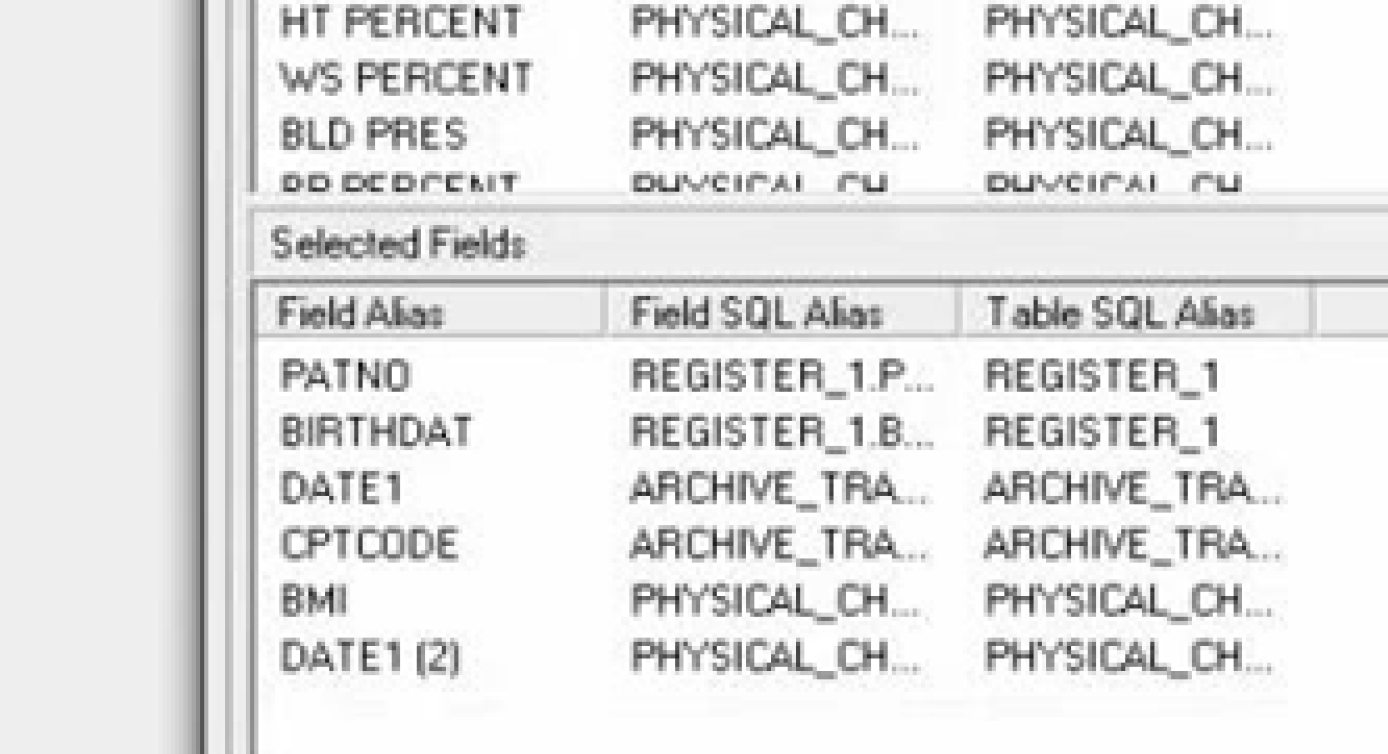
You’ll see that PHYSICAL_CHART.DATE1 is abbreviated DATE1(2) to distinguish it from ARCHIVE_TRANSACTIONS.DATE1, which (since we put it in first) is abbreviated DATE1.
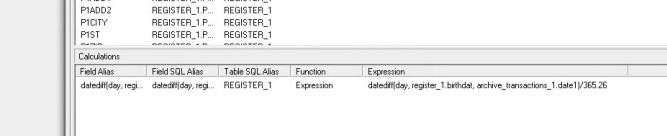
Now we have to enter the calculation to find the patient’s age.
In the Query Designer, click on the Calcs tab. Click on any field, set Function to Expression, and enter the following in the Expression field:
DATEDIFF(day, register_1.birthdat, archive_transactions_1.date1)/365.26
…which computes the date differential in days between the BIRTHDAT field and DATE1 fields, then divides by 365.26 to get the years elapsed between the two arguments – the DOB and the DOS:
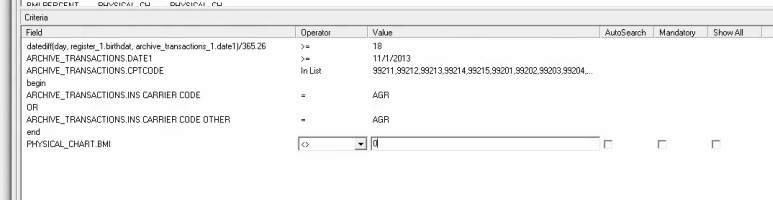
In the Query Designer, in the Search tab, now we set the search parameters:
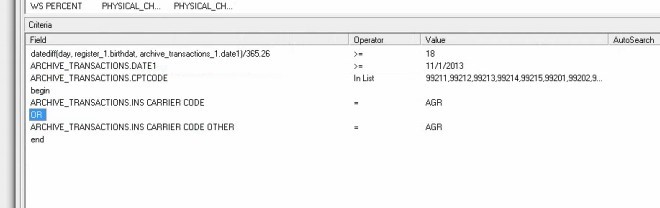
Set the following:
- DATEDIFF(day, register_1.birthdat, archive_transactions_1.date1)/365.26 > 18 [age > 18]
- ARCHIVE_TRANSACTIONS.DATE1 > 11/01/2013 [date of service on or after 11/01/2013]
- ARCHIVE_TRANSACTIONS.CPTCODE In List 99211, 99212, 99213, 99214, 99215… [billed CPT code in the “approved list”]
- ARCHIVE_TRANSACTIONS.INS_CARRIER_CODE = AGR or ARCHIVE_TRANSACTIONS.INS_CARRIER_CODE_OTHER = AGR [insurance code 1 = Amerigroup or insurance code 2 = Amerigroup]
Part Two: Initial Results
Now let’s run a preview to see where we are. Click on the Data tab, which so far shows a blank report, then on the Preview button (on the far left):
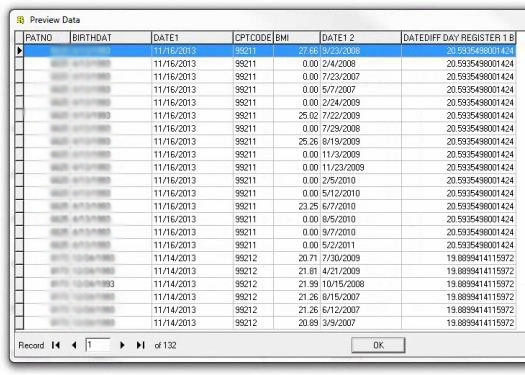
We see several rows of patient #6625, date of birth 4/13/1993, date of service 11/16/2013, with CPT code 99211, age 20.59 years. These all represent the same patient on the same DOS with a single CPT code – so why does this patient appear 16 times? Because every time the patient had vital signs taken in our practice – not just 11/16/2013, there is an entry under that PATNO in the PHYSICAL table. The DATE1(2) field lists all those dates, and the BMI column shows the BMI computed on that date of service.
On some days, a BMI was not computed – if, perhaps, a weight was obtained but not a height. For those dates (like 2/4/08 or 7/23/07), the BMI value shows 0.00.
Since these dates have null values for what we’re interested in, we can exclude them from the report:
And re-running the Data/Preview view, we see that we only have “meaningful” BMIs present now.
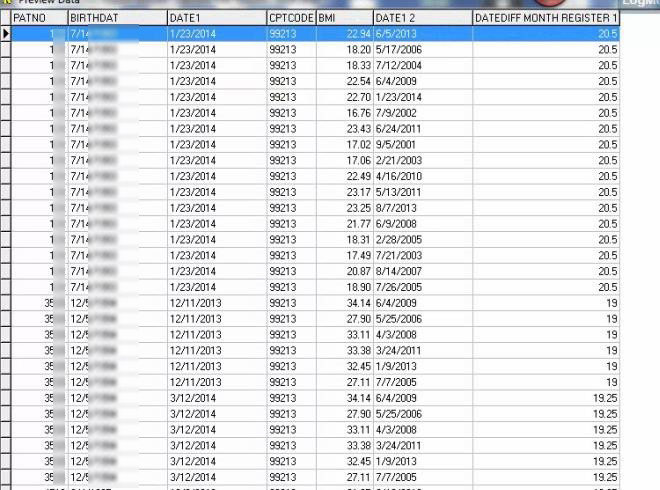
Now we see that patient #182, born 7/14/1993, who we last saw on 1/23/2014, has had 17 different BMIs in our office, ranging from dates 9/5/2001 to 8/7/2013. The BMI dates are jumbled up, so we will want to set our sort parameters so that they sort first each patient’s data separately, then sort that patient’s BMIs from oldest to newest. The SQL piece would look like:
ORDER BY REGISTER_1.PATNO, PHYSICAL_CHART_1.DATE1 and the data will appear as:
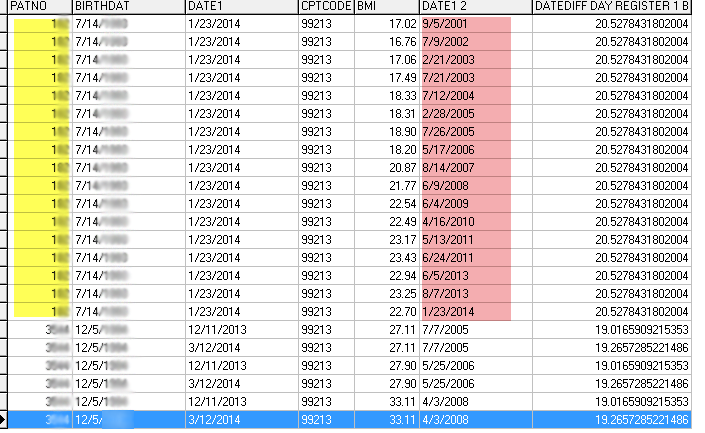
An alternate strategy would be to sort by patient number, then by age on date of BMI. We can do this because a larger age, numerically, means a more recent date in time. We can’t use the existing DATEDIFF column on the right, though – notice how all the ages for the patient are the same? That’s because that age field is computed on the difference between their most recent visit (the DATE1 column) and their date of birth. To use this strategy, we’d want to make a new age column using the BMI date (the pink column). In the Calcs tab of Query Designer, we’d make a variable:
DATEDIFF(DAY, REGISTER_1.BIRTHDAT, PHYSICAL_CHART_1.DATE1)/365.26
…and then change our sort instructions to
ORDER BY REGISTER_1.PATNO, DATEDIFF (DAY, REGISTER_1.BIRTHDAT,
PHYSICAL_CHART_1.DATE1)/365.26
…but that’s probably unnecessarily complicated.
Now what this patient’s BMI was back in 2001 is not really relevant to what we need now! We want our report to only show only the most recent BMI, since that’s the one we want to classify into a V-code and send to the insurance company. Since we’ve sorted from oldest to newest, this will be the last BMI for any given patient in the report as it stands now.
To show only the last row of data for a given patient, we can put our data fields in the Group Footer band, grouping by PATNO. We lay out the fields using the DBText tool and straighten them using the Align tools:
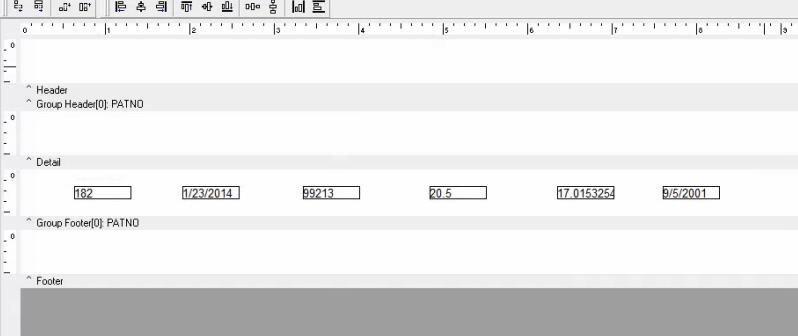
By contrast, if we wanted to show all rows of data for a patient, we would put these 6 data fields in the Detail tab.
If we put these 6 DBText elements in the Detail band, then our report would look essentially identical to what we see in the Report Data button – all the rows for all the patients for all the dates. By keeping it in the Group footer where we have Grouped by PATNO, we only see the last instance of that PATNO. If we wanted to show only the first row of data per patient, we would put these data fields in the Group Header by PATNO tab.
The “last row per patient” is determined by how we’ve sorted the data. Since we’ve sorted by BMI date (ascending, since newer dates are considered “bigger numbers”), we get the most recent BMI.
You could get the exact same results by putting the fields in the Group Header [0]: PATNO band if the BMIs were sorted newest to oldest. To toggle between sorting in ascending and descending order, tick the Desc (Z>A) box in the Sort Fields window:
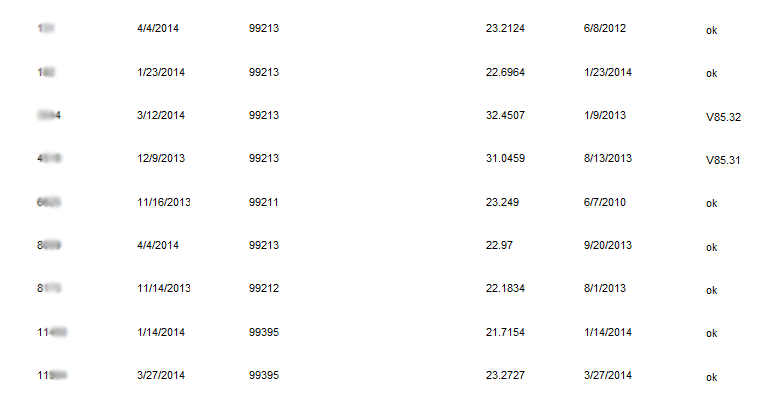
Now that we have laid out the data, we go back to the Data tab, click the Preview button and the result is:
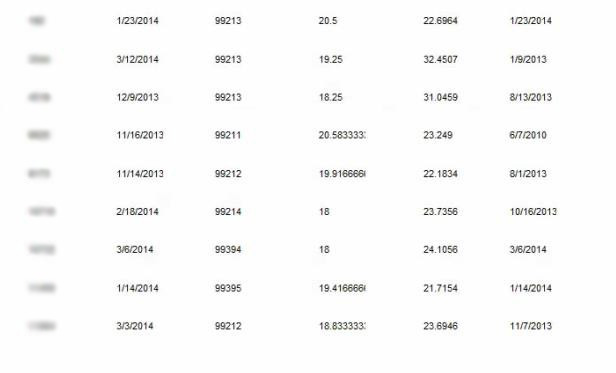
Each patient is now listed only once, as we wanted – with a relatively-recent BMI for most patients.
Part Three: A Computed Variable
Rather than having to look up the correct V code for the degree of obesity for each patient, we can create a variable to do this computation for us. This would be even more important for a report with several hundred rows.
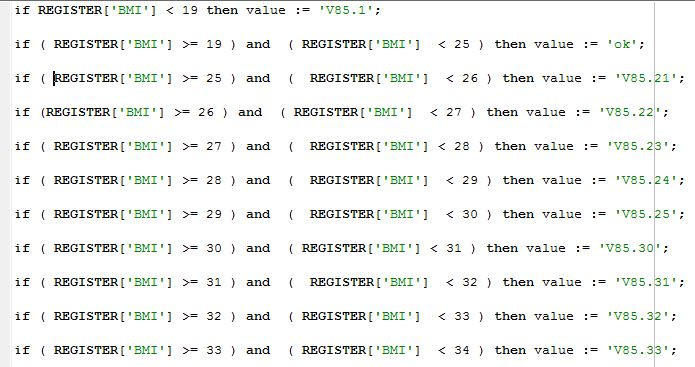
We can place a DBVariable along the other data rows, then right-click on it and enter the following:
![]()
This series of if… then… statements sets the value of the variable to the correct diagnosis code (or “ok” if the diagnosis code is not present in the list furnished by Amerigroup) based on the BMI value.
By copy-pasting and tweaking, we can continue the list:
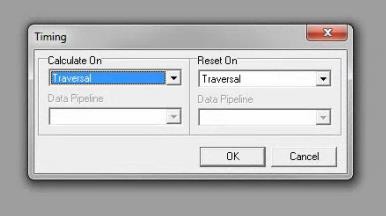
We want to be sure that this variable recalculates for every row, so we right-click on this calculated variable, then choose Timing and set both Calculate On and Reset On to Traversal:
So our final report looks like this:
We could further play with the report, like excluding the “ok” rows by excluding BMIs that are within the “normal” BMI distribution of 19-25. That is, we add a Search parameter to show only BMIs above 25 or below 19:
