
The Data Tab and Using Query Designer
You can type out all the SQL and create an OP Report, but sometimes it’s simpler and faster to use the Query Designer from within ReportBuilder. This creates nicely pre-formatted SQL queries based on a point-and-click interface.
To open the Query Designer in ReportBuilder, click on the Data tab, then go to File… New… and choose Query Designer.
The tabs in Query Designer include:
|
Tab |
Contains |
SQL Output |
|
Table |
A list of all the available OP Reports tables that can be added to your report. If you select more than one table, you can choose how to join the tables here. |
FROM [table “” not found /] |
|
Fields |
A list of all the fields available in the table(s) selected in the first tab |
SELECT [field(s)…..] |
|
Calcs |
Calculations on the raw table from the database. |
Many options for calculations and transformations, like SUM, CASE, CAST, MIN, MAX, COALESCE, others. |
|
Group |
To show only distinct values shown by the column in the GROUP BY. This is not the same as report Groups (see See Module 4, Part 4, “Grouping”); since it can be confusing, that’s all we’re going to say about SQL Groups in this document. |
GROUP BY |
|
Search |
Specify the criteria that will filter your report. |
WHERE |
|
Sort |
Sort results according to one or more columns (see SORT“) |
ORDER BY… |
|
SQL |
Directly view the resulting SQL of your query in progress. You can modify the SQL directly in this field to add more complex SQL not supported by the Query Designer by right-clicking on the SQL text. However, once you start editing the SQL text directly, you will no longer be able to use the Query Designer to modify your query. The text in this window is the “essence” of your report. If an OP Report isn’t behaving like you think it should, you can copy this SQL directly to show the “guts” of your report when asking for help. |
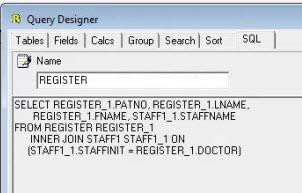 |
TABLE tab
To add a table or field to the query, double-click the table or field from the list of options, and it will appear in the Selected area below.
When you add subsequent tables, you will be prompted how you want to join the new table to the extant table(s):
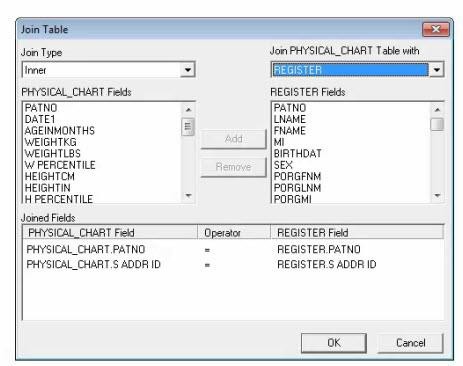
The new table being added is listed in the top (in this case, PHYSICAL_CHART) and the possible joins are in the drop down box just below it (here, REGISTER is shown.) If you choose a left or right outer join, remember that the table you are adding is always the “right hand” table, and the table already there is by convention always the “left hand” table.
Be careful accepting what OP Reports suggests a possible join. For example, let’s say we want to create a list of patients and their BMIs. We’ll need the patient names from the REGISTER table and the BMI information from the PHYSICAL_CHART table. So within the Tables tab of Query Designer, we add both of these to the Selected Tables list by double-clicking their names.
Query Designer then suggests a possible join: an inner join (upper left hand corner), which we agree with. It suggests joining PHYSICAL.CHART.PATNO to REGISTER.PATNO, which is just what we need. But it also suggests joining PHYSICAL_CHART.S_ADDR_ID to REGISTER.S_ADDR_ID. This looks OK at first glance – both fields have the same name, so they’re the same thing, right?
Sort of: S_ADDR_ID is often used in OP to designate the user number of the person who created or last updated the record. In many medical offices, a receptionist or medical secretary will create and update the REGISTER records (patient demographic information) while a medical assistant or nurse will weigh and measure patients and input those values into OP.
If we retain the join PHYSICAL_CHART.S_ADDR_ID = REGISTER.S_ADDR_ID, then we are looking only for patient names and BMIs in which the same user ID entered both the patient register information and the BMI information. This is unnecessarily restrictive and will include many, if not most, of our patient records. So we want to remove this join by double-clicking on the PHYSICAL_CHART.S_ADDR_ID = REGISTER.S_ADDR_ID line in the Joined Fields window. It will disappear, leaving only the PATNO join.
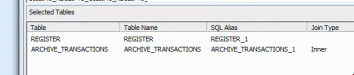
Within the Query Designer, the tables in use, the table aliases (see SQL Aliasing below), and the join(s), if any, are found at the bottom of the tab as they are added:
To remove a table, double-click that table line in the Selected area, and it will disappear. Note: any table that appears in the Selected Table list below the table you’re removing will also be removed.
SQL Aliasing
Just to make things more complicated: There is a slight difference between the standard SQL we’ve been discussing up to now and the SQL that ReportBuilder uses. It’s called Table Aliasing.
|
What we expect to see |
What we actually see |
|
SELECT REGISTER.PATNO, REGISTER.LNAME, REGISTER.FNAME, STAFF1.STAFFNAME FROM REGISTER INNER JOIN STAFF1 ON (STAFF1.STAFFINIT = REGISTER.DOCTOR) |
|
Instead of referring to the REGISTER table by that label, it’s called REGISTER_1; the STAFF1 table is called STAFF1_1. The alias is used the first time the table name is found in the SQL, right after the table name itself:
FROM REGISTER REGISTER_1
INNER JOIN STAFF1 STAFF1_1
You don’t have to use aliases. But it’s generally a good idea, especially if you use two copies of a single table twice (for example, it’s common in financial/receivables reports to use two copies of ARCHIVE_TRANSACTIONS).
FIELDS tab
After you have chosen and joined your tables, all the fields in those tables will be listed as Available Fields in the FIELDS tab. Double click them to add them to the Selected Fields list, and double click a field on the Selected Fields list to remove it from the list.
Fields may also be aliased. They automatically inherit the table alias assigned in the TABLE tab: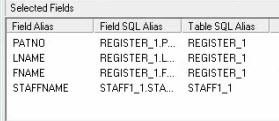
CALCS tab
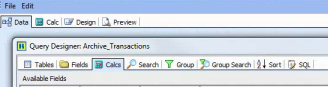
Note: the CALCS tab in Query Designer (under the DATA tab) is different than the CALC tab in OP Report Builder. The OP Report Builder tabs (Data, Calc, Design, Preview) are above the Query Designer tabs (Tables, Fields, Calcs, etc.) below:
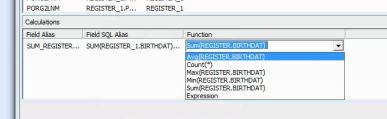
Calculations are manipulations of existing fields. The calculation will be run on every row that is returned by the query. To create a calculation, double-click on the field you want to manipulate in the Available Fields pane. Then, in the Calculations pane below, select the kind of calculation you want: a freeform Expression or a preset calculation such as SUM, MIN, MAX, COUNT, or AVERAGE:
Examples of freeform Expressions that may be useful:
EXTRACT([period] from [date]): gives the numeric month from a date value.
For example, EXTRACT(MONTH FROM ARCHIVE_TRANSACTIONS_1.DATE1) would return “3” if ARCHIVE_TRANSACTIONS_DATE1 was March 19, 2015. Similarly, EXTRACT(YEAR FROM ARCHIVE_TRANSACTIONS_1.DATE1) would return “2015.” Other periods are DAY (which returns 1–31); WEEKDAY, which returns 0-6, where 0 = Sunday; and YEARDAY (0-365, where 0 = January 1.)
DATEDIFF([period], [older date], [newer date]): gives the number of time periods elapsed between the two dates.
If you want to see how many days have elapsed between a charge date, ARCHIVE_TRANSACTIONS_1.DATE1, and a payment date, ARCHIVE_TRANSACTION_2.DATE1, you can use the expression DATEDIFF(DAY, ARCHIVE_TRANSACTIONS_1.DATE1, ARCHIVE_TRANSACTION_2.DATE1).
SEARCH tab
The SEARCH tab is where you enter the meat of your query. You can construct simple or complex criteria.
Let’s say we want to create the following query to find a list of active patients whose PCP is doctor CLR with primary, secondary, or tertiary insurance BLU:
SELECT REGISTER.FNAME, REGISTER.LNAME FROM REGISTER WHERE (REGISTER.STATUSPAT = “ACTIVE”) AND (REGISTER.DOCTOR = “CLR”) AND ((REGISTER.INS_CARRIER_CODE = “BLU”) OR (REGISTER.INS2_CARRIER_CODE = “BLU”) OR (REGISTER.INS_CARRIER_CODE_3 = “BLU”))
After selecting table REGISTER and fields FNAME, LNAME, we’re ready to add search criteria to restrict the DOCTOR and insurance fields.
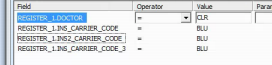
To search on DOCTOR, double-click DOCTOR in Available Fields so it appears in the Criteria pane below. Then set the operator dropdown to = and enter CLR in Value:
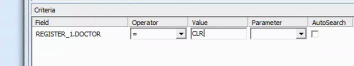
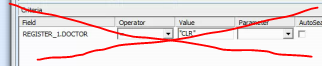
Note that in raw SQL, we must put “CLR” in quotes. But in the Query Designer, don’t put quotes in the Value field unless you are specifically looking for quote marks.
Next, we need to restrict our search to patients with BLU insurance — either their primary, secondary, or tertiary insurance. We start by finding each of the relevant fields and adding the search criteria:
However, we haven’t specified that we want the three insurance criteria to be OR criteria — that is, show us any patient for which one or more is true. Without specifying this, all listed criteria are required, e.g. an AND query. As the query appears above, we are looking for CLR’s patients who have primary insurance BLU and secondary insurance BLU and tertiary insurance BLU.
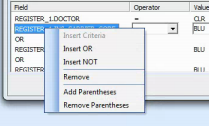
We can insert two ORs by right-clicking on any of the insurance search fields and choosing Insert OR
And now we almost have the final search:
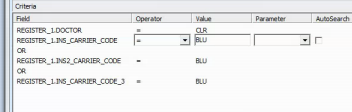
Except, look at the criteria closely. Query Designer will interpret our query like this:
Find patients (whose doctor is CLR and who have BLU primary) OR (have BLU secondary) OR (have BLU tertiary.)
What we really want is a query that says:
Find patients (whose doctor is CLR) AND ( (who have BLU primary) OR (have BLU secondary) OR (have BLU tertiary)).
So we need to add parentheses to our query to clarify. We can add parentheses by right-clicking on the search criteria, the same way we added the ORs. If the parentheses don’t appear in the right place, we can move them up and down using the arrow buttons on the right side of the pane:
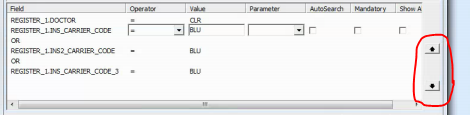
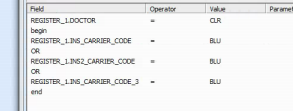
Open parenthesis appears as “begin” in the pane, and closed parenthesis appears as “end.” Once we have finished tweaking the parentheses, our search criteria should look like this:
If you’re not sure whether you need parentheses, add them. Extra parentheses don’t hurt anything.
You can use other types of Operator besides Equal:
|
Greater Than Less Than Greater Than/Equal To Less Than/Equal To |
> < >= <= |
Typically used for numeric and dollar comparisons (e.g. ARCHIVE_TRANSACTIONS_1.CHARGE >= 0.01 will find charges greater than or equal to 1 cent) but can also be used for dates, e.g. REGISTER_1.BIRTHDAT >= 1/1/2015 will find all patients born in 2015 or later. |
|
Not Equal To |
<> |
Finds all occurrences where a field is not exactly what is given, and there is a value in the field (i.e. not blank.) Searching for REGISTER_1.MI <> K will find all patients whose middle initial is not K, but won’t show patients who don’t have a middle initial. |
|
Between |
Between |
Finds all occurrences where a field is in a range. The range is two limits, separated by commas. The range includes the limits; that is, ARCHIVE_TRANSACTIONS_1.CHARGE Between 50, 100 includes charge line items between $50.00 and $100.00 (including $50.00 and $100.00, but not $100.01.) Frequently used for date ranges. |
|
Like |
Like |
Finds all occurrences where text matches a wild card. The percent sign (%) is used to designate wild characters. For example, REGISTER_1.LNAME = M% finds patients with last names Miller, McAdams, and Ma. REGISTER_1.FNAME = %M% finds patients who have an M anywhere in their first name: Morgan, Amy, or Adam. |
|
In List |
In List |
Finds all occurences where a field matches anything in a comma-delimited list. For example, if you want to find patients with primary insurance of UHC, OXF, or UH1, you can look for REGISTER_1.INS_CARRIER_CODE In List UHC, OXF, UH1. This is much simpler than a complex OR construction like: |
|
Blank |
Blank |
Finds all occurrences where a field is blank. This can be tricky because, for some fields, OP stores a blank as a zero. In these cases, you’d want to search for TABLE.FIELD = 0, rather than TABLE.FIELD Is Blank. |
|
Not Between Not Like Not In List Not Blank |
The inverse of their respective functions (Between, Like, In List, and Blank.) |
OP Reports can have static or dynamic search features. In static searches, the search criteria are the same every time you run the report (unless, of course, you edit them in the Design tabs.) Dynamic searches let you change search criteria when you load the report at run time. This type of screen is probably familiar to you:
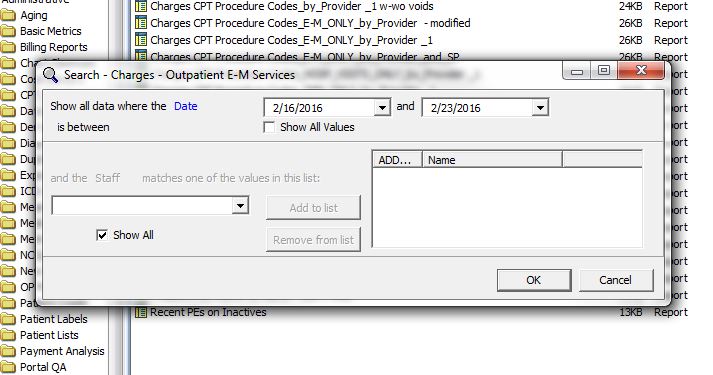
This particular report is set to prompt the user who runs it to set the Date in the top panel and a list of staff in the bottom panel. Notice how both have the option to show all values, and that this is the default option for the staff listing. To create these options for your report, set them in the Search Criteria panel:
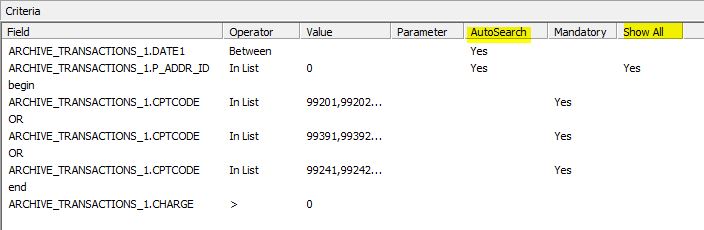
The AutoSearch checkbox set to Yes indicates that the user will be prompted to choose the criteria for this element at run time. Notice here how the user can choose the Date and Staff (P_ADDR_ID), but the CPT code and charge values can’t be edited at run time.
By checking the Show All box, this defaults the report to show all staff members at run time. This can be unchecked by the user if desired.
Bonus: not only can you search on criteria for regular fields, you can also search on criteria for calculated fields. Available CALCS will always appear at the very bottom of the Available Fields pane. So if you made a DATEDIFF calculation in the CALCS tab of Query Designer, you can enter a search criteria to limit your search to rows whose DATEDIFF is above 30:
SORT tab
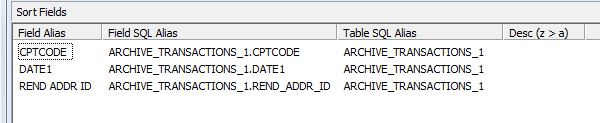
The SORT tab lets you decide how you would like your data organized. Here is an example of sort instructions for a provider productivity report that lists the date of service (DATE1), the rendering provider (REND_ADDR_ID), and the CPT code (CPTCODE):
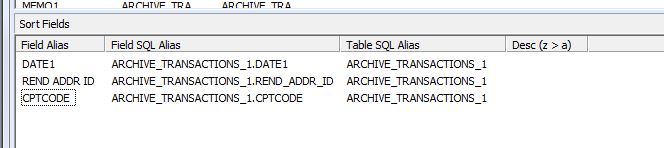
The sort instructions here tell Report Builder to sort first by the date of service, then by the provider, then by the CPT code. This will give a result like this
|
1/6/16 |
104 |
99213 |
|
1/6/16 |
105 |
99214 |
|
1/7/16 |
104 |
99212 |
|
1/9/16 |
105 |
99213 |
|
1/10/16 |
104 |
99203 |
However, by using the up/down arrows on the right side of the panel, we can rearrange the sort order as follows:
…and the same data will be ordered like this:
|
1/10/16 |
104 |
99203 |
|
1/7/16 |
104 |
99212 |
|
1/6/16 |
104 |
99213 |
|
1/9/16 |
105 |
99213 |
|
1/6/16 |
105 |
99214 |
To sort the data in reverse order (e.g. newest to oldest dates, largest to smallest amounts), tick the Desc (z > a) field in the panel.
SQL Tab
The SQL tab allows you to see how the tables, fields, joins, calculations, search, and sort criteria all come together to form the query for your report:
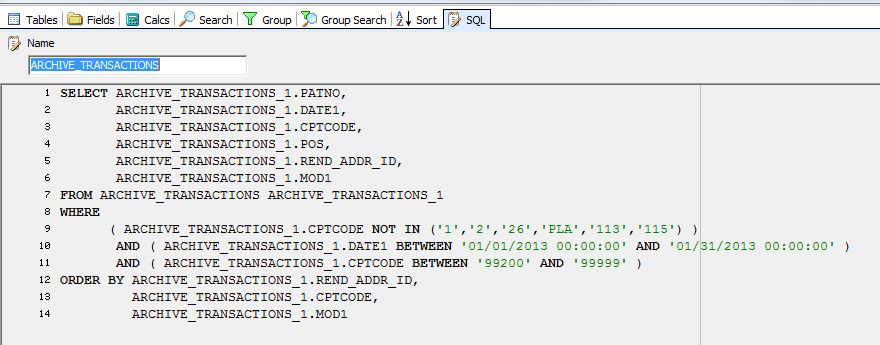
One quick way to share the “guts” of your report (e.g. for troubleshooting purposes) is to copy this text and paste (or email) the text. It’s a lot faster than exporting the entire report.
You can edit the SQL directly from this panel by right-clicking the grey part of the panel and choosing Edit SQL. However, once you’ve done so once, you can no longer use the other Design panels to edit the query.